Carbon footprint and climate change
We fully understand our impact on climate change due to our activities. We are committed and willing to engage all efforts needed to reduce the CO2 emissions generated by our activity, directly and indirectly. We strongly believe that our actions in this regard will overcome important milestones for our business resilience.
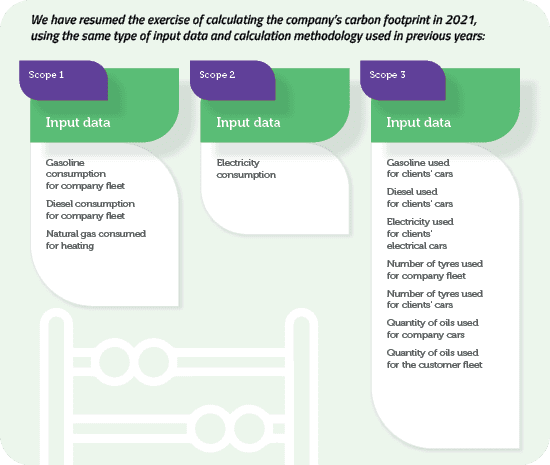
Based on this awareness, in 2021, in the process of defining the Sustainability Strategy, we calculated the organization’s carbon footprint (CCF) with the support of the denkstatt consultancy company. The footprint was calculated by assessing Scope 1 (direct emissions), Scope 2 (indirect emissions) and Scope 3 (indirect emissions). The methodology used for the inventory of CO2 emissions was the GHG Protocol standard and the assessment and quantification was spread over a 3-year period (2018, 2019, 2020). Furthermore, as the share of the operational fleet is significant in the direct use of our customers
This initiative was a great time to understand the structure of emissions from our business and the limitations of the impact we can have.
After calculating through the GHG Protocol methodology, we understood that over 99% of our footprint is in Scope 3, allocated to the fleet used by our customers.
And this approach has become apparent as the source with the greatest potential to mitigate our environmental impact.
While the possibility of substitution with a lower emission vehicle is higher for cars operated by employees or rented on a short-term basis, the long-term fleet, which is already engaged in operational contracts, has a slower possible speed of substitution, generated both by customer preferences and the current development of the electric vehicle infrastructure geographically throughout Romania.
Since then, it has become an increasingly clear role for Autonom in integrating and embracing this transition to a greener fleet, by having a concrete plan for the coming years, while increasing global understanding and awareness of the impact among our partners.
We have started to work on substitution scenarios and benchmarking, with a medium and long time horizon, 2020÷2025÷2030, taking into account also the prospects for market developments and regulations at European level in the transport sector.
The indicator closest to our work and the optimal quantifiable link to our upstream (vehicle suppliers) and downstream (short, medium and long term customer) value chain partners and public authorities was the WLTP (Worldwide Harmonised Light Vehicle Test Procedure) value measured in gCO2/km, available for each individual car, based on the manufacturer’s information and official documents of each car. As a result, the scenarios for decreasing environmental impact over the
End Year Operational fleet | Baseline 2020 | Real 2021 | Target 2025 | Target 2030 |
|---|---|---|---|---|
Average WLTP CO2g/km | 153.57 | 149.32 | 115.13 | 75.87 |
% reduction | - | -3% | -25% | -51% |
At the same time, taking into account changes in the fleet structure in terms of increasing the share of lower emission cars (electric and hybrid cars), the results achieved at the end of 2021 confirm the alignment with the targets declared:
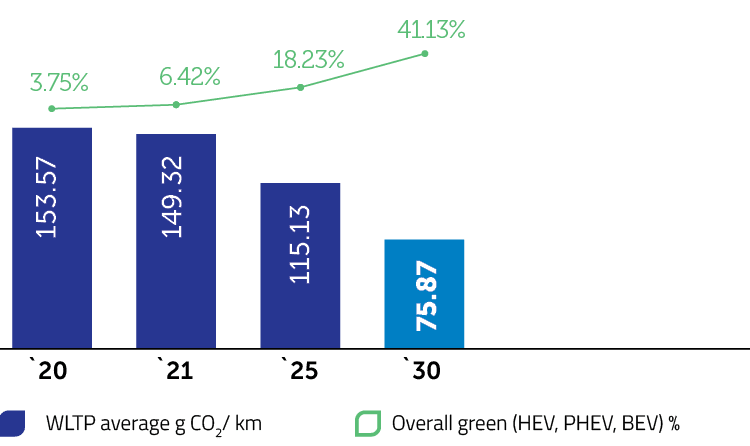
2020 | 2021 | 2025 | 2030 | ||
|---|---|---|---|---|---|
WLTP average | g CO2/ km | 153.57 | 149.32 | 115.13 | 75.87 |
Overall green (HEV, PHEV, BEV) | % | 3.75% | 6.42% | 18.23% | 41.13% |
Out of which, electric | % | 0.49% | 1.68% | 9.43% | 27.39% |
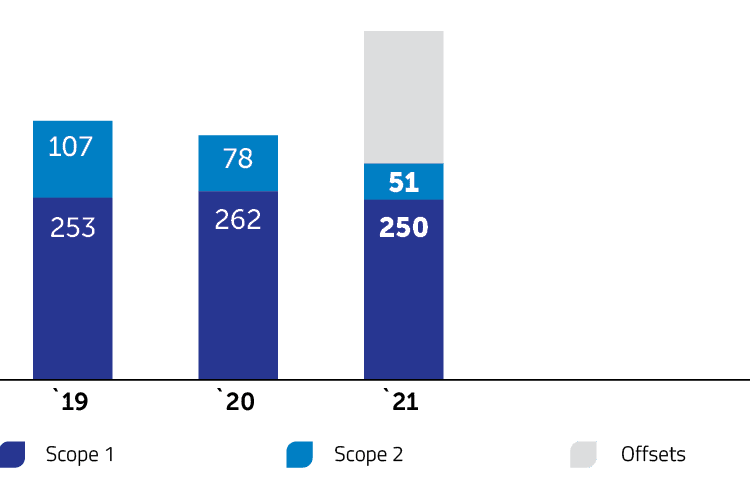
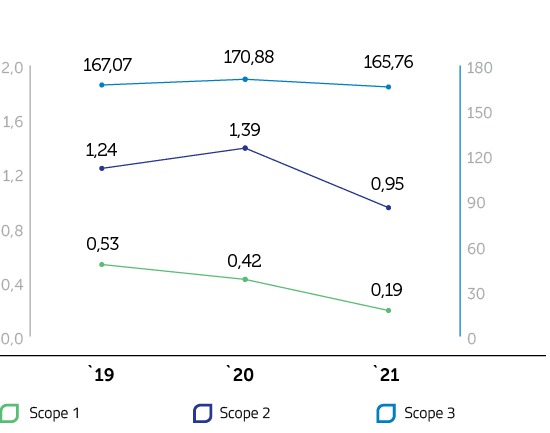
Source of emissions | Unit | 2019 | 2020 | 2021 |
|---|---|---|---|---|
Scope 1 | t CO2 | 253 | 262 | 250 |
Scope 2 | t CO2 | 107 | 78 | 51 |
Scope 3*limited | t CO2 | 34,004 | 37,909 | 43,780 |
Note: We used for our GHG` Inventory calculation the methodology of the standards - The Greenhouse Gas Protocol: The Corporate Accounting and Reporting Standard, WRI & WBCSD.
Through the partnership with OMV Petrom, started in March 2021, whereby we offset direct emissions related to the fuel run through them for the whole year, we received carbon certificates equivalent to 3,972.70 tons of CO2. This covers the full GHG emissions of Scope 1 and Scope 2 and 10% of the operational fleet (Scope 3).
Conclusions
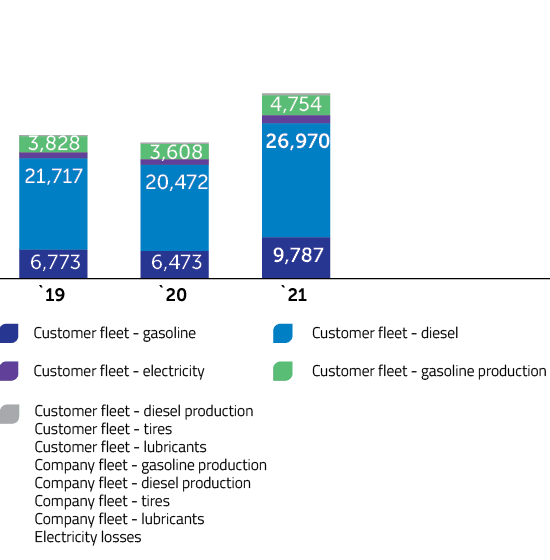
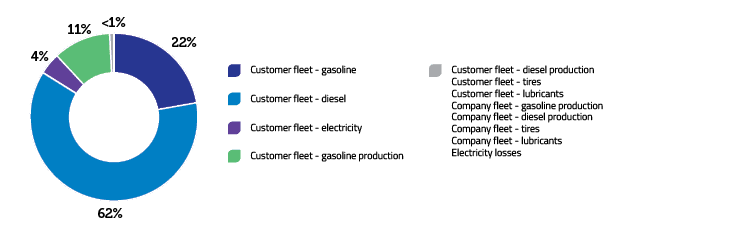
Our main source of emissions remains Scope 3, indirect emissions. This area is responsible for more than 99% of our total emissions.
Diesel cars are responsible for 62% of all Scope 3 emissions, down 2% from the previous year.
15% of our Scope 3 emissions are related to the production of diesel and gasoline used by our customers, while 1% are emissions related to the use of lubricants and tires.
The largest share of total emissions is still accounted for by the diesel fleet, as they serve the activity of most companies in the active operational fleet, with extensive mobility needs that cannot be met at the moment by electric cars alone.
An important observation to note is the decrease in emission intensity per km.
With the resumption of normal operations in various business sectors, the easing of pandemic conditions has led to an increase of more than 40% in kilometers driven by our customers, while the increase in emissions from the fleet they operate has been limited to 36%.
This efficiency improvement confirms the downward trend needed to achieve the targets in the emissions area and gives us a better perspective of where we have the greatest indirect impact. As a result, in 2022, we will intensify our focus on transitioning to a greener fleet with less environmental impact.
We have also considered SBTi (Science Based Targets Initiative) scenarios in terms of reducing the environmental impact for our fleet, taking into account the Target modeling for 2DS (2 degrees Celsius) according to the SBTi transport calculation tool (https://sciencebasedtargets.org/sectors/transport) and updated the calculation by including data for 2021:
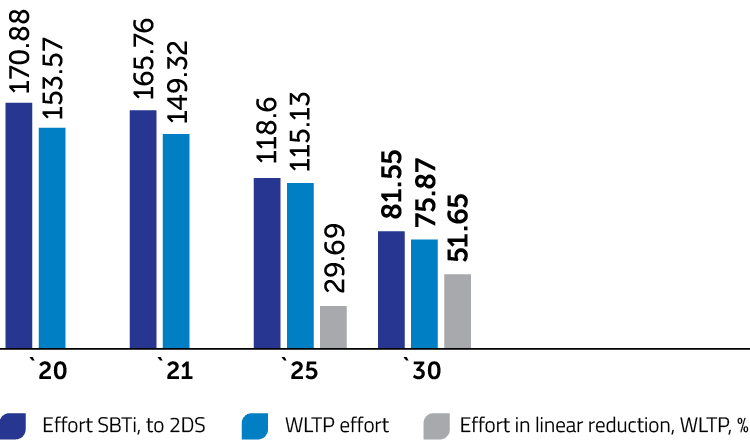
The benchmarking analysis shows the intensity reduction potential required for our fleet and the main areas that need to be considered for fleet replacement to meet the compliance rate required by the EU Directive, as well as the added value for CO2 intensity reduction for our company’s footprint. This comparison takes into account direct linear decrease options for WLTP, which could be considered and could reflect potential effort for substitutions.
Similar to the other results presented above, this analysis also confirmed the downward emissions trend for the 2021 operational fleet.